The Ultimate Guide to Understanding Augmented Analytics - Everything you need to know
Augmented analytics is no longer restricted to assistive features, as it has moved to a mission-critical operating model. Here at datalance, we aim to resolve all your queries regarding Augmented analytics, including how it works and what it is, where it helps people, and the tools that are used for Augmented analytics.
Introduction to Augmented Analytics
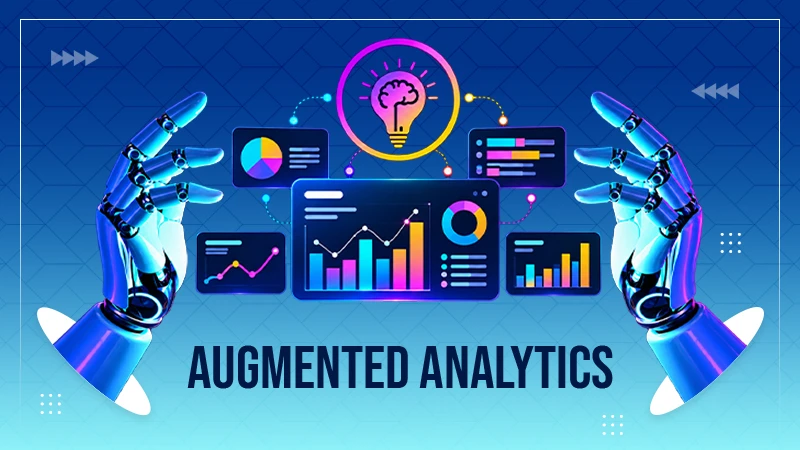
Augmented analytics refers to the use of machine learning and artificial intelligence to strengthen and expedite the entire analytics process. This process includes everything from preparing data and discovering insights to communicating results. What is important to understand is that augmented analytics is not there to replace human analysts and their analysis; rather to augment and simplify their work by automating repetitive tasks and making insights more accessible and valuable.
Analysts used to spend hours and sometimes even days using traditional BI tools to clean data, write queries, and even build dashboards. Augmented analytics reverses the entire model, as the algorithm handles the majority of the heavy lifting, while a natural language interface lets business users ask questions in simple language and receive answers in explainable form immediately.
Understanding the working of Augmented Analytics
Along with learning what is augmented analytics, it is also important to know how the process of augmented analytics works. The following steps state how this process is conducted to present the best results to the user:
Augmented data prep and connectivity
The process starts with the correct prep of AI-powered auto-joins, suggested no-code, and generative code-based data. This enables people to bring the correct data together for analysis.
Automated insight discovery
Once the data is collected, machine learning starts detecting any anomalies, correlations, and even trends that usually take humans hours to discover.
Natural language interaction
At this step, anyone can easily query data conversationally, whether they have SQL or a specialized technical skill.
Generative narratives and customized reporting
This transforms complex data and analysis into simple and tailored recommendations that can be understood by people easily.
AI agents and agentic workflows
After this, AI agents and agentic workflows turn analysis and reporting into smaller and manageable subtasks. Analysis, reporting, and deep dives are turned into scalable tasks.
Predictive, prescriptive, and proactive intelligence
AI agents explore and describe more than what has simply happened. These agents also forecast what is likely to happen next and what could happen based on the inputs provided. The agents also recommend the next best action, and proactive intelligence highlights anomalies to users.
Explainability and trust
The results are not simply presented in a flat structure. Augmented analytics highlights the whys and hows behind any outcome and offers straightforward narratives to people, which builds confidence in decisions.
Scalability
Scalability is an important aspect of augmented analytics, as modern platforms can easily analyze billions of records from numerous sources in a second, which eliminates data silos.

Augmented analytics works as a partner for both business leaders and analysts. It removes the barriers between data and business teams and accelerates the process of discovery for analysts. This allows users to focus on strategy and advanced modelling instead of endless reporting cycles.
Importance of augmented reality in 2026
Enterprise data isn’t just growing; it is exploding at a fast pace. Companies stash petabytes in cloud warehouses, tracking everything from marketing and sales to finance and operations. Every time someone clicks, buys, or even files a prescription, there’s a new data point logged. And yet, here’s the weird thing: despite all this data piling up, businesses still struggle.
Decisions take too long, departments don’t talk, and the insights they dig up barely scratch the surface. In 2026, augmented analytics isn’t a nice-to-have. It’s the backbone. The old ways just can’t keep up: data’s too complex, there aren’t enough skilled people, and the competition’s relentless.
Factors behind the urgency
Data is increasing faster than it can be analyzed
First, the data’s pouring in way faster than anyone can actually analyze it. Those traditional dashboards and reports? They’re falling behind. An augmented analytics platform steps in and automates the grunt work: digging through billions of records and spotlighting what matters, almost instantly.
Scarcity of analysts
Good analysts are tough to find, and the ones you have are swamped. Augmented analytics lets anyone poke around in the data using plain language, opening the door for non-experts to uncover answers, while freeing up analysts to tackle big strategic puzzles.
Speed is the new parameter
Lastly, speed is what everyone is seeking. Markets move in weeks, not months. The companies that jump from “what happened?” to “what should we do next?” are the ones who grab market share, cut risks, and leave competitors behind. With augmented analytics, you cut out all the tedious back-and-forth, getting real-time answers and recommendations.
Put it all together and the picture’s clear: augmented analytics has graduated from shiny new tech to something every organization needs to survive and thrive. It’s not just about finding insights faster. It’s about building a business that adapts, grows, and edges ahead in the age of AI.
Advantages of augmented analytics
Using augmented analytics is not simply about modernizing your technology; rather, it is all about transforming how decisions are made across industries. There are numerous benefits of augmented analytics that organizations see and embrace, some of which we are mentioning here:
Faster time to insight
Probably the biggest advantage of augmented analytics is its speed. Data organization and management used to take weeks and weeks initially; however, now it happens in minutes. Augmented analytics easily automates detection of anomalies, analyzes the root cause, and delivers answers while the opportunity still exists.
Better decision-making
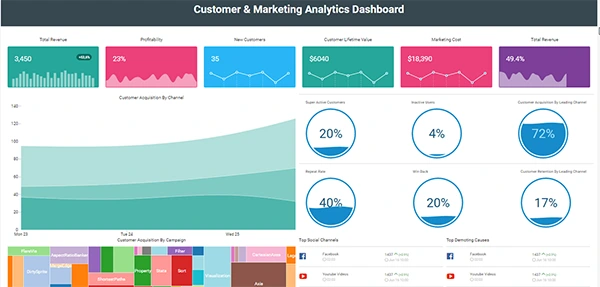
Augmented analytics dashboards show what happened and also explain why the particular thing happened. Additionally, the agents will also recommend what your next actions should be. This context provides confidence to leaders to move quickly without thinking too much about their data.
Cost and efficiency gains
By reducing dependence on human reporting and repetitive tasks, businesses can easily cut down wasted effort. Augmented analytics not only assists businesses in saving time, but also prevents expensive mistakes that happen because of delayed or incomplete insights.
Democratized access to insights
Team leaders, field leaders, and even managers do not need any special SQL skills to access this data. The use of natural language for interaction ensures that anyone can ask related questions regarding the data directly.
Stronger organizational agility
In the present volatile market situation, being agile is everything. Augmented analytics provides businesses with the freedom and opportunity to act quickly whenever the need arises, whether it means shifting their market strategy or spotting errors quickly.
Better foundation for the future
By integrating ML and AI into the analytics workflow, companies can easily think about their future and ensure that the next gen of agentic analytics can work seamlessly. These AI agents will not simply answer your questions, but also execute analysis and recommend actions without any prompting.
Main components of Augmented Analytics
Every solid analytics platform has six key building blocks. First, you get automated data prep: it cleans up the raw data before you ever see it. Then there’s semantic modeling, which basically gives shared meanings to everything so everyone speaks the same business language.
Natural-language query? That’s where you type a question, and the system translates it into calculations you can trust. Next is insight generation, which digs around for trends and surprises. Visualization recommendation helps pick the right chart for your message. Finally, governance and lineage let you trace every answer straight back to its source.
People shopping for these tools focus on the flashy front doors; the language interface gets all the attention in demos, and in renewal meetings, everyone debates the semantic modeling.
Exploring the best augmented analytics tools in 2026
Augmented analytics tools make sure that you know where to start and how to proceed. These tools ensure that you can easily get to know everything you wish to know.
Microsoft Power BI and Fabric
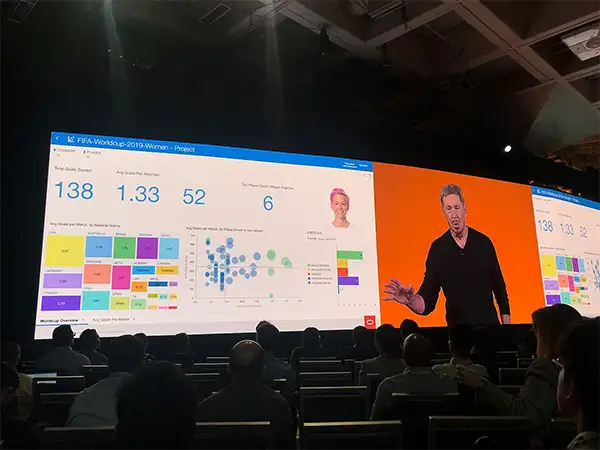
Power BI and Microsoft Fabric probably have the shortest governance path, as these tools are already connected to Microsoft data platforms. Copilot in BI and Fabric easily generates summaries for people and answers their questions without issues.
Tableau
Another tool leading the augmented analytics market is Tableau owing to its visual analytics depth. It is equipped with metric-level insights that it provides to its users without any prompting and showcases results in a visual form that are better understood by users.
Qlik
The associative engine of Qlik explores relationships between two things even without a fixed join path. If any business leader has a suspicion, Qlik can easily follow the trail and provide all the answers in a concise manner.
ThoughtSpot
ThoughtSpot is a search-first tool where the front door is a question and not a dashboard. This particular design is perfect for organizations where self-service adoption has been the main working structure.
FAQs
What is augmented analytics in 2026?
Augmented analytics uses machine learning (ML) throughout the stages of data analysis, preparation, and delivery of insight. By 2026, it will incorporate autonomous workflows to automate analysis and to push business-approved updates to systems.
How do we evaluate the success of augmented analytics?
Consider the change in the metrics before and after the introduction of augmented analytics (e.g., time-to-insight, time-to-action, adoption, and approval). Also quantify the effects on the business, such as additional revenue, reduced cost, and reduced risk.