Top 18 Data Analysis Tools in 2026 (Traditional and LLM-Based Tools Covered)
Analyzing data is imperative for harnessing its potential. This has been hinted at by Mik Kersten, a noted Canadian data scientist, who said, “Analytics is the use of data to turn uncertainty into insight.”
But you can’t work on a spreadsheet to segregate the complex data piling up every day and then derive valuable insights out of it, and expect it to be accurate and worthy. So data analytics tools are a proven boon for sorting out this challenge.
Here is a comprehensive account of the top 18 tools for data analysis with their overview, merits, and demerits. Also, go through the 5 LLMs that are being used widely for data analytics to smooth out the business processes.
Top 18 Data Analysis Tools
The data analysis tools catalyze the process of collecting, classifying, visualizing, and extracting perceivable insights from it. These business excerpts help in understanding the drive of human behavior and making informed decisions.
Although many such tools have been developed so far, the best ones are discussed below with their pros, cons, and pricing.
| S. No. | Data Analysis Tools | Best For | Capterra Ratings |
| 1 | Microsoft Power BI | Business Intelligence Dashboard | 4.6/5 |
| 2 | Tableau | Advanced Data Visualization | 4.6/5 |
| 3 | Apache Spark | Big Data Processing | 4.6/5 |
| 4 | KNIME | Visual Workflow Data Analysis | 4.6/5 |
| 5 | Microsoft Excel | Basic Data Analytics | 4.8/5 |
| 6 | RapidMiner | ML and Data Mining | – |
| 7 | Python | Data Science Programming | – |
| 8 | R | Statistical Computing And Graphics | – |
| 9 | Jupiter Notebook | Code Sharing Documentation | 4.7/5 |
| 10 | Qlik | Associative Data Discovery Analytics. | 4.5/5 |
| 11 | Dataiku | Collaborative Data Science Platform | 4.6/5 |
| 12 | Databricks | Lakehouse Data Analytics | 4.5/5 |
| 13 | Throughspot | AI-Powered Search Data Analytics | 4/5 |
1. Power BI
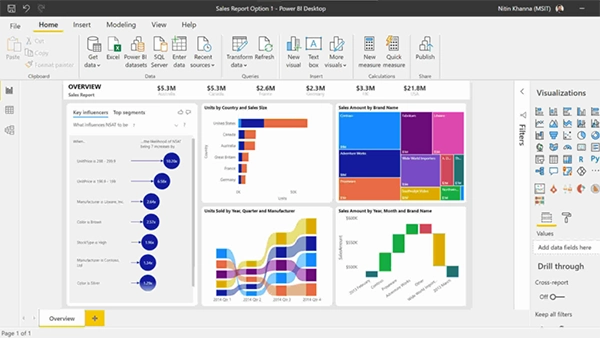
Microsoft Power BI (Business Intelligence) is basically a data visualization software in the Microsoft suite. Launched in 2011, it has gathered much fame due to its ease of learning and interactive visualization options. The integration of Copilot at a nominal price has helped in making natural language queries.
| Merits | Demerits |
|
|
- Pro: $14
- Premier per user: $24
- Embedded: variable price
2. Tableau
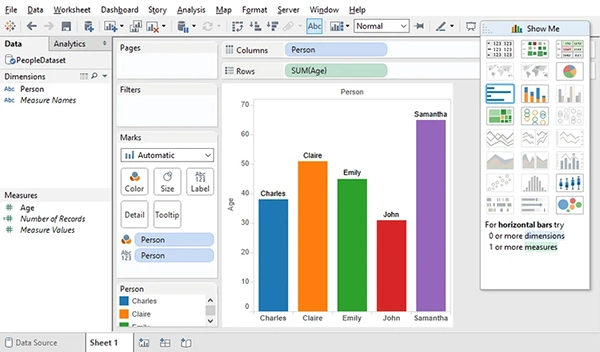
Tableau is another of the best business intelligence and analytics platforms. The SQL at its core assists in translating user actions directly to SQL, MDX, or PL/SQL queries. It’s multisource data blending, connectivity to relational databases, and cloud warehouses further boost its performance. Its in-memory analytics engine, i.e., Hyper, aids in rapidly processing massive data sets.
| Merits | Demerits |
|
|
- Tableau Standard: $15
- Tableau Enterprises: $35
- Tableau Cloud +: Variable Price
3. Apache Spark
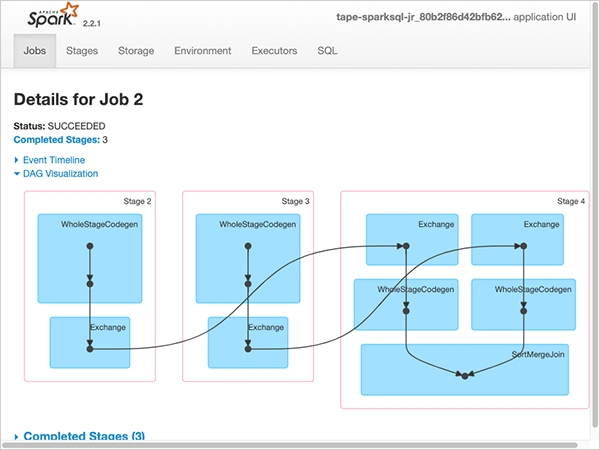
Apache Spark is an open-source distributed warehouse engine. The memory processing feature further elevates the data processing to the next level. Its core components include Shark Core, Shark SQL, MLlib, and GraphX, which are used to extract meaningful data and derive insights. This makes it one of the most used data analytics services amongst the Fortune 500 companies.
| Merits | Demerits |
|
|
- Platinum: $125k/Year
- Gold: $50/Year
- Silver: $25/Year
- Bronze: $6/Year
4. KNIME
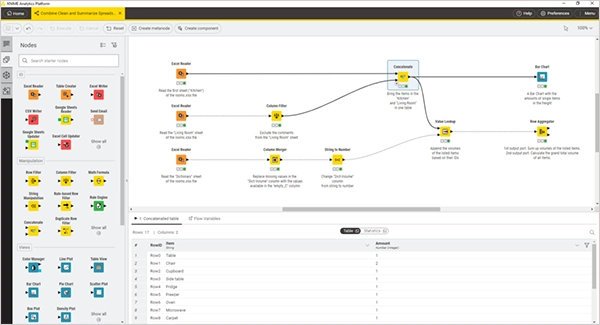
KNIME, i.e., Konstanz Information Miner, is an open source data analytics platform released in 2006. Coded in Java, it is considered great for large data volumes, and its added plugins further expand its scope. It also integrates with other open source programs such as R Project, Spark, and H2O.
| Merits | Demerits |
|
|
- Pro: $19/Month
- Team: $99/Month
- Businesses Hub: Variable Price
5. Microsoft Excel
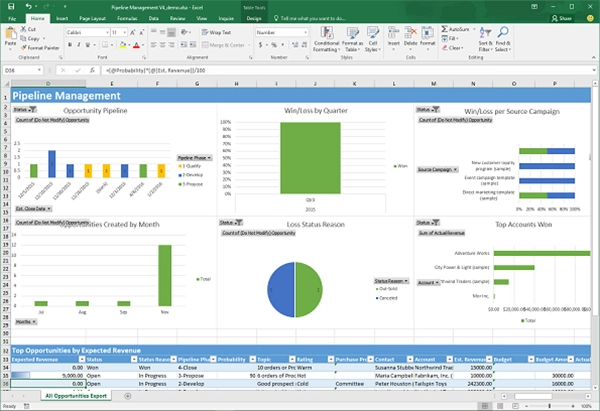
Microsoft Excel is the most common and renowned tool for data analysis, seen as the pioneer in the field. The recent integration of Copilot has further expanded its scope in this field manifoldly. Its Windows, Mac, and web interfaces all work smoothly and efficiently, and the constant Microsoft updates keep it aligned with the emerging needs.
| Merits | Demerits |
|
|
Plan and Pricing: $179.99
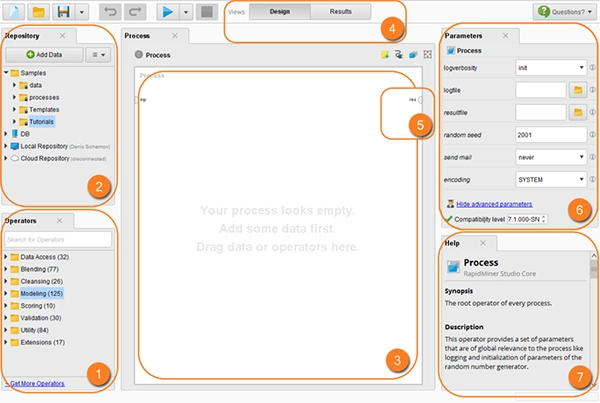
6. RapidMiner

RapidMiner, earlier known as YALE, was acquired by Siemens in 2025. It is a sort of complex program with components like RapidMiner Studio, RapidMiner AI Hub, and RapidMiner Go. It has recorded millions of forwards and provides service to some of the top firms across the world, like BMW, Intel, and Cisco.
| Merits | Demerits |
|
|
Plan and Pricing: Get a Quote
7. Python
Python is actually a programming language, but its efficient libraries make it one of the best options for data analysis. For example, NumPy is one of its libraries used for numerical computations while simplifying the data analysis, mathematical operations, and large-scale data processing functions.
| Merits | Demerits |
|
|
Plan and Pricing: Free
8. R
R is also a programming language by its nature, generally used for statistical computing and graphics. It basically collects, cleans, and transforms the available data into certain structured formats to simplify its comprehensibility. Being a free and open-source software, it is a widely used language in data analytics, next only to Python.
| Merits | Demerits |
|
|
Plan and Pricing: Free open-source
9. Jupyter Notebook
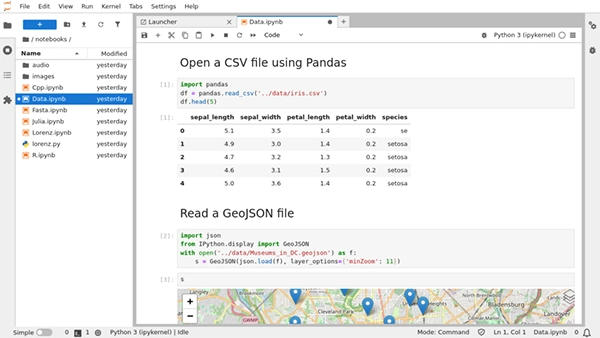
Jupyter Notebook is a web-based interface that emerged out of IPython. This tool is built out of many open-source libraries such as Bootstrap, jQuery, Tornado, etc. It is widely used for exploratory data analysis, statistical modeling, cleaning, and visualizing data in a wide range of global firms.
| Merits | Demerits |
|
|
Plan and Pricing: Free and open source
10. Qlik
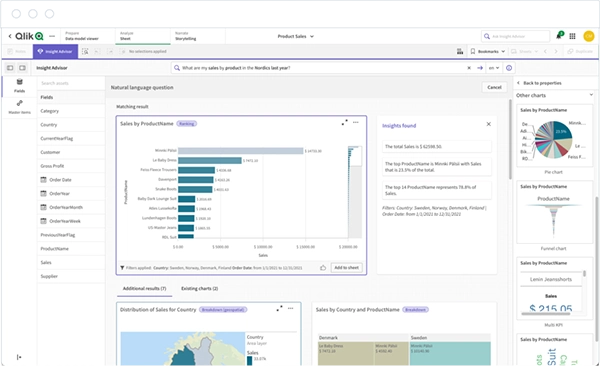
Qlik was founded in 1993 and has since been a recognised name in the field of data analytics. The associate data model and insight advisor with dashboard designing capabilities make it easier to use and exploit. Although the cost might look a bit higher than other available tools, its value makes a fair judgment.
| Merits | Demerits |
|
|
- Starter: $300 Per Month
- Standard: $825 Per Month
- Premium: $2750 Per Month
- Enterprises: Custom Pricing
11. Dataiku
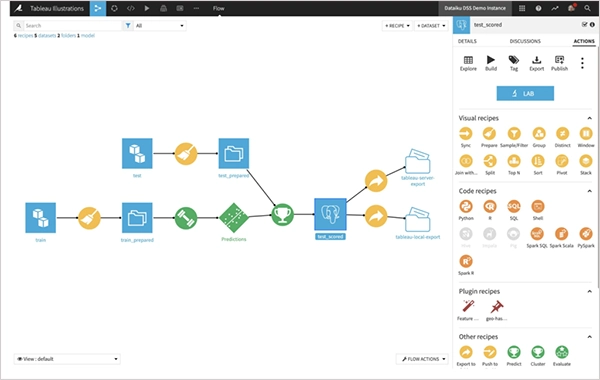
Dataiku has been one of the best cost-friendly data analysis tools in the market since 2013. It amalgamates machine language, artificial intelligence, and smart data techniques to assist data scientists, data engineers, and even business analysts in deriving meaningful inferences. Users belonging to the team can make edits through code or simply through the Excel sheets.
| Merits | Demerits |
|
|
Plan and Pricing: Custom Pricing
12. Databricks
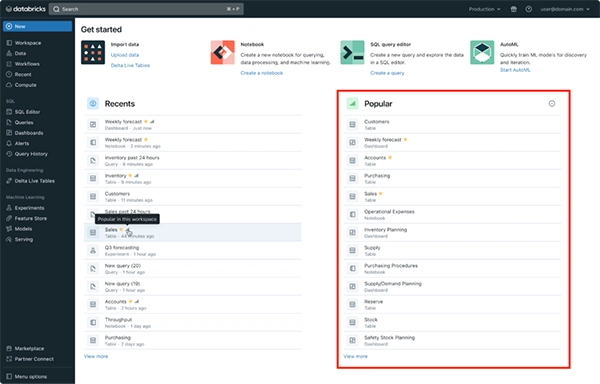
Databricks is based on a data lakehouse architecture that combines various data lakes into a unified structure. It is a completely cloud-based platform with wide capabilities of data analytics supported by AI-integrated tools. Although it is costlier than other platforms like Power BI, it has been rated as one of the top data analytics tools on ranking portals like Capterra.
| Merits | Demerits |
|
|
- Data Engineering: $0.15/Databrick Unit
- Data Warehousing: $0.22/Databrick Unit
- Interactive Workload: $0.40/Databrick Unit
- Operational Database: $0.069/Databrick Unit
- Artificial Intelligence: $0.07/Cu
- Genie: $0.07/Databrick Unit
13. ThoughtSpot
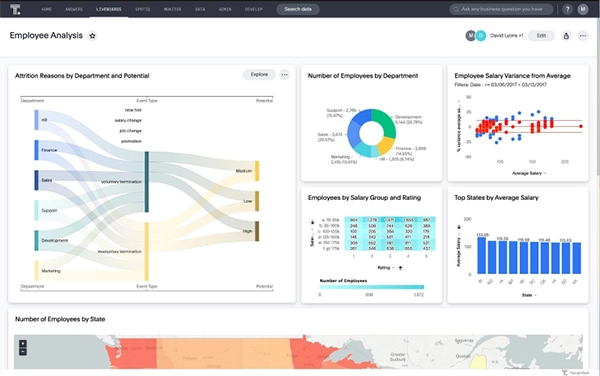
ThoughtSpot is a business intelligence software used for creating data models and analyzing them through natural language. The liveboard, i.e., a real-time dashboard, presents the live changes in the data and immediately refigures the insights accordingly. It is highly demanded in e-commerce, financial, manufacturing, and retail sectors.
| Merits | Demerits |
|
|
Plan and Pricing: Pro- $50
Top 5 LLM for Data Analytics
The top 5 LLMs for data analysis are GPT 4.1, Claude AI, Gemini, DeepSeek V3, and Llama 3.1.
These LLMs have varied capabilities, which makes them good for certain tasks. Below is a crisp brief of their pros, cons, pricing, and what they are best for.
GPT-4.1 – by OpenAI Pros - Handle large data
- Good code generation
- Great reasoning
Cons - Higher cost
Best For - Python based codings
- Advanced data analytics
Pricing - Go: $8 per month
- Plus: $20 per month
- Pro: $100 per month
- Business Codex: Usage Pricing
- Business ChatGPT and Codex: $20 per month
- Enterprises: Custom Pricing
Claude AI Pros - Great data reporting
- String reasoning
Cons - Limited ecosystem compared to OpenAI
Best For - Business analytics
- Long data analysis
Pricing - Pro: $20/month OR $200/year
- Max 5x: $100
- Max 20x: $200
Gemini by Google Pros - Integration with bigquery and google cloud
- Great context window
Cons - Reasoning benchmarks change performance
Best For - Multimodal analytics
- Large-scale data analysis
Pricing - Google AI Plus: $4.99/month
- Google AI Pro: $19.99/month
- Google AI Ultra: $99.99/month
Deepseek V3 by Deepseek Pros - Good coding capacity
- Affordable
Cons - Limited tool set
Best For - General data analytics
Pricing - Api Access: $0.14/1 million tokens
- Enterprises: Custom Pricing
Llama 3.1 by Meta Pros - Strong open ecosystem
- Highly customisable
Cons - Specific infrastructure is required to run it.
Best For - On-premises data analysis
Pricing - Llama 4 Maverick: $0.19–$0.49 Per 1M token
- Llama 4 Scout: $0.19–$0.49 Per 1M token
What is Data Analysis and its Methods?
Data analysis is the collection, segregation, and proper classification of data to extract insights by making it more understandable and comprehensible to ultimately make informed decisions.
Britanica defines data analysis as “data analysis, the process of systematically collecting, cleaning, transforming, describing, modeling, and interpreting data, generally employing statistical techniques.”
With the technological revolution exploring new avenues every day, data generation is also compounding rapidly, reaping which is the best opportunity we have.
Data scientist W. Edwards Deming has enlightened the masses with a simple truth by saying, “Without data, you are just another person with an opinion.”
Data analysis is not a monolithic concept but has certain steps and types as well. The key steps in the process are:
Defining The Objective
↓
Data Collection
↓
Data Cleaning
↓
Data Visualization
↓
Model Building
↓
Data Analysis
↓
Drawing Conclusions
The data analysis methods based on nature are qualitative, quantitative, and mixed data analysis methods. These methods vary based on the aim of serving the results, i.e., focusing more on the objective, subjective, or both outcomes.
1. Qualitative Data Analysis
Qualitative data analysis is a subjective dimension that derives insights and trends, the underlying factors, and possible patterns
For example, the sales data in an e-commerce site can help you understand in which season what remains in demand, how people behave with the sales offers, etc.
2. Quantitative Data Analysis
This method focuses on the quality, i.e., what the data has. It is highly relevant for objective insights and decision-making.
For example, any e-commerce website takes all the KPIs and analyzes the trend to derive conversion rate, customer acquisition cost, and return on investment.
3. Mixed Data Analysis
It combines the features of both qualitative and quantitative data analysis. It is mostly used to depict the status and the concerned impact.
For example, you ask for the data about the percentage of people buying a product and in which season it sells the most.
What are the Benefits of the Data Analysis Tool?
Data visualization, querying, data integration, shareability, automation, and real-time analytics are the benefits of data analytics tools.
These benefits can be observed in all fields that the data analytics tools serve. Let’s take a look at each one of them.
- Data Visualization: The data analysis tools have simplified the visualization of complex data, which simplifies extracting productive insight from the piles of information. The storytelling composition further helps grasp the essence of the data.
- Querying: Recent advancements in the field assist you in getting outcomes by asking questions about the data. For example, you may ask, “Give me the net retention rate of sales by region.” This makes data analysis a conversational task and a data analysis tool a personal analytics assistant.
- Data Integration: Some data analytics tools can integrate with your data source directly. This makes real-time changes in the data analysis when the stats and figures in the business change.
- Sharing Insights and Conclusions: The shareable reports and insights are helpful in exchanging and discussing the trends.
- Automation of Tasks: Tools for data analysis automate the operation, especially the repetitive ones, to reduce the chances of human error and save time.
- Real-time Analytics: It helps in incorporating and utilizing the live data collected through various devices to gauge the trajectory of the trends.
Contemporary Trends In Data Analysis
The trends in data analysis in the past few years are AI integration, more emphasis on data ethics, data democratization, unified data architecture, deep visualization, big data analytics, and augmented analytics.
This has been possible due to the rapidly evolving technological progress and a growing demand for exploiting the available data for business profits. These trends are described as follows:
- AI Integration: The incorporation of AI for data analysis has somewhat reduced the need for human analysts in data analysis. AI directly analyses the bulk of data, matches it with previous data sets, learns new trends, and simplifies the analysis and integration process.
- Emphasis on Data Ethics: This ensures the ethical and moral use of data throughout its process. It honors and adheres to the values of privacy, transparency, fairness, unbiasedness, accountability, and security.
- Data Democratization: The data analytics tools are gradually connecting the stakeholders in a single thread. This negates repeated data access permissions. Just a few clicks and data from all departments and groups come to your screen.
- Unified Data Architectures: Models like data mesh and data fabric are gradually heading toward low or no-code data preparation processes. This will further simplify data gathering and analysis processes.
- Deep Visualization: The emphasis on storytelling and intricate visualization is turning the direction toward reports with no dashboards. Well said by Brent Dykes, data strategy consultant and author: “The skill of data storytelling is removing the noise and focusing people’s attention on the key insights.”
- Big Data Analytics: With a numerically increasing number of devices, the data is also increasing exponentially, opening the gates for big data analytics.
- Augmented analytics: It harmoniously blends machine learning, artificial intelligence, and natural language models to remove workflow friction and save time and effort.
There are many developments going on in the background to sort out some daunting challenges in the field, like IBM raising the issue about the inaccurate, inconsistent, invalid, incomplete, and duplicate data. Once the solutions are ready, they will further improve the quality of the data, which will further raise the predictability of the trends.
Conclusion
The data analysis tools not only simplify your understanding of the data available but also help you in making smart data-backed decisions. However, with the integration of AI, big data tech, and unified and democratic architecture, its scope is going to be more vast and deep in the contemporary and newly emerging fields.
FAQs
Q1: Which tools are used for data analysis?
Ans: Power BI, Tableau, Apache Spark, KNIME, MS Excel, Rapidminer, Python, R, Jupyter, Google Analytics, Qlik, Dataiku, Databricks, and Thoughtspot are used for data analysis.
Q2: Is Excel a data analytics tool?
Ans: Yes, Microsoft Excel is a data analytics tool, performing tasks like data organization, complex statistical analysis, and visual representation of data.
Q3: Can ChatGPT be used for data analysis?
Ans: Yes, ChatGPT can clean and transform the data, execute code in Python, and present the data insights in visually intuitive graphics.
Q4: Which AI is best for data analysis?
Ans: ChatGPT, Claude, Llama, Gemini, DeepSeek, and Llama are the best AIs for data analysis.
Q5: Is coding required for data analysis?
Ans: Data analysis does not always require coding. The visually exhibited insights and light querying languages negate its need. But learning coding can help you get good opportunities in this field.
Sources: