What Does a Data Analyst Do? Skills, Tools, and Career Path
“What does a data analyst do?”
The role of a data analyst is to collect, clean, summarize, and convert the data into reports and dashboards that help make business decisions. Data analysts work in every field, from finance to retail.
Whether you are planning to switch your career into data or understand this role and its responsibilities, know the skills, certifications, degree, salary potential, and demands in the future.
Quick Answer:
What does a data analyst do?
A data analyst collects, organizes, cleans, and analyzes data to answer business questions. Here is what this job role includes:
- Data collection and cleaning from multiple sources
- Using Excel, SQL, and Python for querying data
- Creating interactive reports and dashboards in visual formats
- Presenting to business owners
- Helping in making business decisions
What Is a Data Analyst?
A data analyst is someone who cleans, summarizes, analyzes, and represents large datasets to help businesses in decision-making. To know more, what is the data analyst’s role in simple words? It is the job to turn raw figures into interesting reports and dashboards by finding trends and problems and making decisions.
They neither build products nor sell them, but he helps with every major decision, from selecting products to launching them to the market.
Here are some confusing terms related to data analysts that you must be aware of.
| Term | What It Means |
| Business Analyst | Analyse data for business processes and strategies |
| Data Engineer | Builds pipelines and systems that store and collect large datasets |
| Enterprise Data and Analytics | Focus on large datasets of the entire organisation to show insights |
| Data Scientist | Use machine learning to build models that help predict outcomes |
| Data Analyst | Work with existing data to help business decision-making |
Note: Don’t be confused between “data scientist” and “data analyst.” A data analyst works with existing data to answer current business questions. While a data scientist builds models to predict future outcomes.
What Does a Data Analyst Do?
What do data analysts do on a regular day? It remains one of the most asked questions. Well, they clean, calculate, summarize, and analyze data and then present it to decision makers in the form of visual reports and dashboards.
The regular tasks of a data analyst differ from industry to industry, but this pattern remains the same in all companies.
Below is a clear description of the everyday tasks of data analysts:
1. Collecting and Cleaning Data
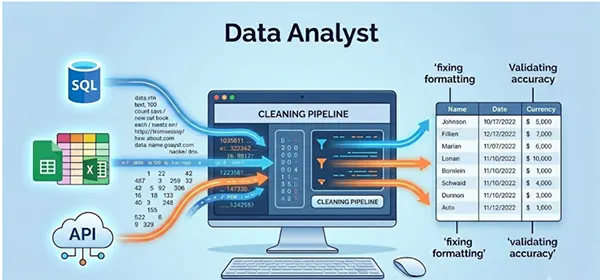
The day starts with collecting data from spreadsheets, databases, third-party platforms, and APIs. The next step for cleaning data includes fixing errors, removing duplicates, and gap filling, as unformatted and duplicate data lead to wrong decisions.
- Use SQL to connect with databases
- Import data from Google Sheets, CSV files or Excel sheets
- Fix formatting and remove duplicate values from the data
- Using the standard format for currency, date, and measurement units
- Validate data accuracy according to known benchmarks
Note: The step of data cleaning usually takes around 60-70% of the total project time.
2. Analysing Data to Find Patterns

Now, let us dive deeper into what data analysts do after the data is cleaned. They use technical tools and statistical methods to locate the pattern, calculate sales, and answer business questions.
- Apply descriptive analysis for totals, averages, and growth rates
- Differentiate customers by region to compare sales
- Track data during a particular season to find the trends
- Highlight problems that can affect growth in the near future
- Find relations among two or more variables quickly
3. Creating Reports and Dashboards
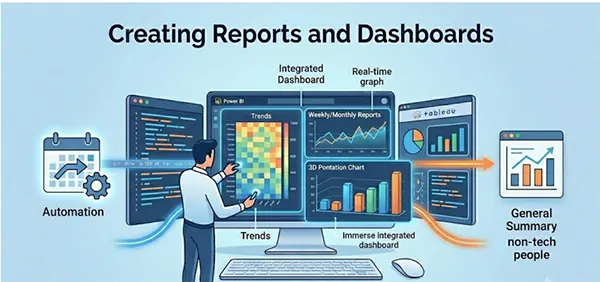
A data analyst’s role does not end just after the summarization of data. The main role is finding insightful information from the reports and dashboards. Business owners don’t pay attention to the raw data; they want to see a visual summary to make decisions.
- Create immersive reports and dashboards using Power BI or Tableau
- Prepare weekly or monthly reports with automation
- Take the help of graphs, charts, and heatmaps to show trends
- Make general summaries for non-tech people
4. Presenting Insights to Stakeholders

What do you do as a data analyst after creating reports and dashboards? People think these are regular tasks, but the presentation of data is as important as analyzing it. A data analyst must know how to explain technical analysis in general terms.
- Create presentations to discuss in meetings
- Answer business questions based on data
- Suggest the next move as per the data analysis
- Work on the document methodology to enhance results
Key Skills Every Data Analyst Needs
People who are working in data analyst roles need both soft and technical skills. You need no degree in computer science to work in this role. However, here are some specific in-demand skills for this role.
| Skill | Category | Why It Matters |
| Statistical Analysis | Technical | Best for quick calculations, summarisation, and trends |
| Data Visualisation | Technical Skill | Create interactive visual dashboards for business decision-making |
| Problem-solving | Soft Skill | Find errors in data before presenting for decision-making |
| Critical Thinking | Soft Skill | Note down the questions before analysing the data |
| Data Cleaning | Technical | Finding errors, duplicate values, and filling gaps in large datasets |
| Data Storytelling | Soft Skill | Explaining complex statistical terms in simple words, especially for non-tech people |
Note: There are two main skills, data visualization and SQL, that most employers look for in data analyst roles.
Tools Data Analysts Use to Work
Most analysts use 3-4 tools every day for work. These tools vary depending on the company and the industry you target. But below are the tools that fit every job role.
| Tool | Primary Use |
| SQL (MySQL, PostgreSQL) | Use databases to clean and summarise data |
| Microsoft Excel | Best for quick calculations, pivot tables, and basic charts |
| Python (pandas, NumPy) | Perfect for cleaning and analysing large datasets with automation |
| R | Statistical analysis and academic-style research reporting |
| Tableau | Create interactive visual dashboards for business decision-making |
| Power BI | Microsoft’s tool for interactive dashboards and reports |
| Google Analytics | Track and analyze datasets for websites about user behavior. |
Pro Tip: If you are just starting, go with learning Excel and SQL first. These two tools are enough to land you in most entry-level data analyst roles. You can learn Python and a visualization tool such as Power BI or Tableau later.
Is Data Analytics in Demand?
Before stepping into the data roles, it becomes important to know if data analytics is in demand. Obviously, according to the University of Maryland Global Campus, more than a 34% growth rate for data analyst roles, which is much more than the average amongst all professions.
See the table of the current job market for data analytics.
| Data Point | Detail |
| Job Growth Rate | 34% faster than average |
| Median Annual Salary | $112,590 per year as per the UMGC |
| Top Hiring Industries | Finance, tech, healthcare, retail, |
| Top Job Titles | Data Analyst, Business Intelligence Analyst, Reporting Analyst |
The demand for data analytics and related roles, including data scientists, is the 4th fastest-growing high-demand career option, with a 34% growth rate.
How to Become a Data Analyst in 2026?
People who want to switch careers often ask, “Is data analytics for me?” If you love working with data, describing complex terms in simple ways, and enhancing problem-solving skills, then this role is perfect for you. Below is a clear roadmap to becoming a data analyst, whether you have a related degree or want to switch your career.
Step 1: Build Your Foundational Skills

Start learning the core skills that you need the most, no matter which industry you target. You can easily learn them for free or at a very low cost through online platforms.
- Starting to learn SQL basics from YouTube or SQLbolt.com.
- Finish an entry-level Excel course; a Microsoft Excel tutorial works fine for it.
- Learn the fundamentals of statistics like data consolidation, merging, appending, distributions, and standard deviation.
- Choose either R or Python as a programming language and learn its fundamentals.
Step 2: Choose a Specialisation

There are several fields in which the data analyst roles exist. Thus, making it clear helps you focus on a particular field and get the job in the right enterprise data and analytics company. Some of the common specializations are given below:
- Product analytics: Cover feature adoption, user behavior, and retention metrics.
- Healthcare analytics: Target insurance claims data, operational efficiency, and patient results.
- Marketing analytics: Work on conversion rates, CTRs, campaign data, and customer engagement rate.
- Financial analytics: Analyze revenue, forecast outcomes, and plan budgeting.
Step 3: Build a Portfolio

Besides your technical and soft skills, companies want to check your real work and skills implementation. Therefore, building 3-5 real projects proves your command of skills and analytical thinking.
- Download sample data from either data.gov or Kaggle.com
- Note down a business question that you will answer with the data
- Clearly summarise and visualise the data with your preferred tools
- Publish it on GitHub and briefly explain your points
- Include the project link in your resume and LinkedIn profile.
Step 4: Get Certified or Earn a Degree

Although you do not need a four-year degree, mastering technical and core skills is more important. However, getting a professional degree adds a cherry on the cake to your resume.
- IBM Data Analyst Professional Certificate from Coursera: It is perfect for learning Excel, SQL, and Python from the basic to intermediate levels.
- Google Data Analytics Certificate from Coursera: This is a widely recognized certification, best for beginners who know nothing about data analytics.
- Microsoft Certified: Power BI Data Analyst Associate: It is a professional certification specifically for Power BI and business intelligence roles.
- Getting a degree in computer science, mathematics, statistics, or economics is also highly preferred for senior roles.
Dos and Don’ts for Aspiring Data Analysts
Read these most important dos and don’ts to start your career as a data analyst with the right roadmap. Please avoid these most common mistakes most people make in the beginning.
Dos
- Start with learning SQL because it is the universal and most demanding skill in all types of data analyst roles.
- Keep in mind the business questions that your data must answer, ensuring you are solving the real business problems.
- You should learn about industry domains wherein you want to work, like finance terminology, as a revenue analyst.
- Create a strong portfolio with three to five real projects before you apply for the first role of a data analyst.
- Always keep yourself updated with the highly demanding skills and latest tools.
Don’ts
- Never analyze the data without clearing it, as duplicate or repeated data often misleads business decisions.
- Don’t demonstrate data without comparison or context, as just numbers have no meaning to a business owner.
- Don’t undervalue soft skills like storytelling, problem-solving, and communication, as they are equally important to your technical skills.
- Don’t spend a lot of time learning everything before you apply because most people learn the most after they get the first job.
Conclusion
Most people question, “What does a data analyst do?” The answer is simple: he converts raw data into meaningful insights that help businesses make better decisions.
Data analysts work from cleaning data to creating interactive dashboards. This is one of the most valuable professionals in data-driven companies. This role is always in high demand, gives a clear roadmap from fresher to senior levels, and pays well.
Next step: Starting to learn Excel and SQL. Download sample data from Kaggle.com and write a few questions that you can answer with your analytical skills.
FAQs
Q1 What does a data analyst do generally?
The role of a data analyst is to collect, clean, summarize, analyze, and display insights that help business owners make better decisions.
Q2 What is a data analyst, and how does he differ from a data scientist?
The work of data analysts includes summarizing data and creating reports and dashboards to track growth. While data scientists use machine learning (ML) for predictive projects to forecast future results.
Q3 How do data analysts help grow a business?
Data analysts track patterns in data that help business owners know what is working and what is not. For example, they can help you find out which products have the highest sales and find customer behavior so that marketing teams target the right customers efficiently.
Q4 What skills should I master to become a data analyst?
The main technical skills include Excel, SQL, and Python or R for summarizing and analyzing data. It is better to master either Power BI or Tableau for data visualization and representation. Moreover, you also need some soft skills such as excellent communication, problem-solving, and analytical thinking skills.
Q5 Do I need a degree to become a data analyst?
No, most people switch to data analyst roles with an IBM Data Analyst Certificate or a Google Data Analytics Certificate rather than a 4-year college degree. Command over Excel, SQL, Power BI, and Python, along with a strong portfolio with real projects, is more important to employers now.
Sources
What Does a Data Analyst Do? By Brain Station