Professional Data Visualization Services for Modern Businesses

Most businesses are struggling with massive amounts of data. Raw numbers and inconsistent spreadsheets give headaches if you do not have sufficient tools and expertise to work with.We are a leading data visualization service provider that helps businesses extract useful insights from complex data. Our data visualization services can help you with those unwanted struggles with complex datasets.

The main aim behind data visualization solutions is to ensure that your data is both visually engaging and highly functional. As one of the best data visualization service providers, we are focused on creating dashboards that are not only pretty, but functional.

100+ Collaborated Works
95% On-time Project Delivery
98% Customer Satisfaction Rate

Data Visualization Expertise We Offer

We have a team of experts who have mastery in data visualization. From optimizing your existing tools to building custom dashboards and self-operating report systems, we design solutions that focus on the pain point of your business,that’s why Datalance is the leading data visualization service provider.

Network monitoring dashboards and server infrastructure representing enterprise data architecture and operations.

Power BI & Tableau Consulting

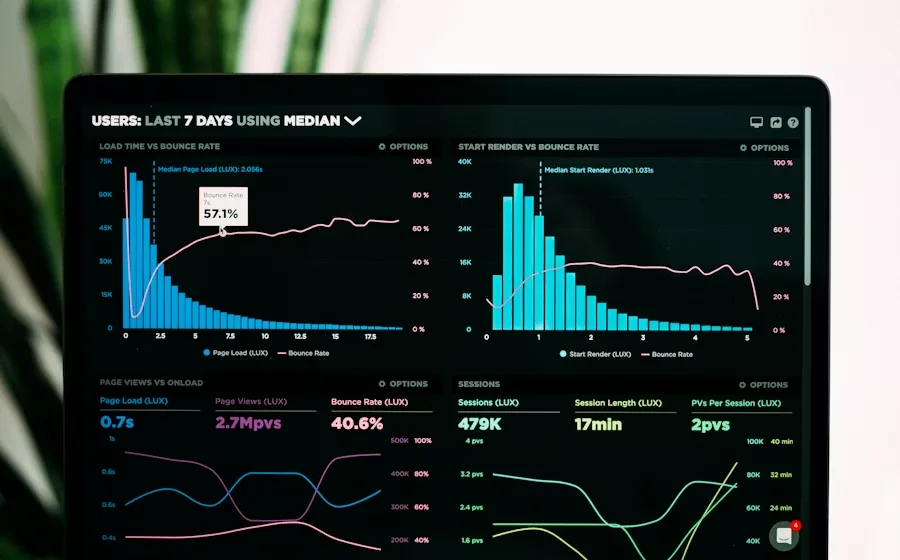
Using Power BI and Tableau for visualizing the data is actually very common, but what organizations struggle with is facilitating their peak efficiency. This is when light stops on us. We take full responsibility for everything from designing dashboards and models to governing performance and testing systems.

Our Power BI & Tableau Consulting Services help businesses in integrating multiple relevant data sources into a single platform, building intuitive report layouts, and clean data models. We have a skillful team that will assist you either way, whether you are starting from scratch or require modification and upgradation in your existing model.

Laptop displaying charts and KPIs for business intelligence and analytics decision-making.

Custom BI Dashboards

Standard dashboards are incapable of actually reflecting the accuracy. So we design and build Custom Business Intelligence Dashboards aligned with KPIs, data sources, and stakeholders’ preferences. Metric charts matter most to every industry, which generic templates miss, but we provide you with user-friendly dashboards to ensure relevant results.

The Custom BI Dashboards we create help organizations with better analysis of trends, detecting opportunities, and confident data-driven decision-making. Our constructed dashboards are easy to navigate and do not require technical expertise.

Abstract visualization suggesting artificial intelligence, neural systems, and advanced computing.

Automated Reporting Solutions

Manual reporting is not just hectic plus time-consuming, but also a costly and error-prone process. We help companies shift from manual reporting to fully automated reporting solutions. As the name says, automated reporting systems generate reports from provided data sources, and we ensure the accuracy and reliability of reports are not compromised due to the loss of human touch.

Automated reports permit a business to enhance consistency, efficiency, and quickness in decision-making. With less manual effort and fewer errors, your team can focus on up-to-date analysis more.

What Your Business Gains When Data Becomes Visual

Data without clear visibility only occupies storage. Here is why Data Visualization is one of the Highest ROI Investments your business can make:

  • Faster, Data-Driven Decision Making
    With the visual presentation of data, the whole process of analysis and decision-making accelerates.

  • Clear Understanding of Business Performance
    Stakeholders require a transparent view of workflows. A custom dashboard is perfect for such requirements.

  • Improved Communication Across Teams
    Easy navigation and accessible insights to technical as well as non-technical teams make it easier to collaborate more.
Analytics dashboard with charts and business metrics.

Outcomes You Can Expect

  • Reduced Time Spent on Manual Reporting

    Automated reporting systems generate visual reports in a few minutes instead of days.

  • Improved Cross-Department Alignment

    A reliable data source directs everybody in one direction by eliminating conflicting numbers.

  • Earlier Detection of Problems

    Spotting errors, decline in performance, or operational bottlenecks is easier with data visualization.

  • Higher Return on Data Investment

    Data Visualization not only extracts the maximum value of your data but also unlocks its maximum potential.

  • Better Tracking of KPIs and Performance

    With interactive dashboards, you can monitor KPIs and performances consistently with accurate analysis.

  • Take a look at how our skills can help organizations solve real business challenges.

    Explore Our Solutions

Industries: Where We Create Real Impact

We have years of experience as a data visualization service provider across industries and ensure industry-specific solutions.

Healthcare

  1. Patient Monitoring Dashboards: Doctors and nurses can check patents vitals reading from several devices at the dashboard from anywhere.

  2. Hospital Operations Visibility: The inventory, stock, and bed availability can be easily analyzed with visual dashboards.

  3. Disease Trend Analysis: Repetitive, seasonal, or triggered diseases are easy to detect in a visual data format.

Fintech & Banking

  1. Real-Time Fraud Monitoring Dashboards: Visual dashboards timely detect suspicious transactions, allowing fraud prevention teams to step in before any serious financial damage occurs.

  2. Customer Analytics and Churn Prevention: Analyzing customer behaviour to predict the risk of a customer leaving can result in a reduction of resource wastage.

  3. Financial Performance Tracking: With a clear view of income, expenses, and other key metrics, timely modification in strategies is possible.

Retail & E-commerce

  1. Sales and Revenue Performance Dashboards: Instant updates in sales or revenue reports with daily growing data are much needed for retailers.

  2. Inventory and Supply Chain Visibility: With the right data visibility, monitoring stock and inventory is easy, and situations like understocking or overstocking are avoidable.

  3. Customer Journey and Campaign Performance Analytics: Relating and integrating both customer data and campaign data is necessary to analyze revenue generation from every source.

Trusted by Forward-Thinking Data-Driven Teams

Our Process

Three Steps to Dashboards Your Teams Will Actually Use

AI discussion and planning session.

Discover & Define

From the very initial stage, while you consult us, we start understanding and gathering data regarding your business, its aim, requirements, etc. We categorize metrics aligned with stakeholders to design the appropriate visualization for the dashboard.

STEP -01

Data systems and dashboard solution design.

Build & Integrate

Here, the actual development process starts. We convert your requirements into visually clean dashboards and reports. After constructing the dashboards, models, and systems, they are inspected and polished with your input before the final delivery.

STEP -02

Automation and AI workflow implementation.

Deploy, Monitor & Optimize

We set up all the dashboards and systems in your workspace, then introduce them to your staff members. After the deployment, we continuously monitor the performance of our build solutions to ensure stability, reliability, and accuracy of the outcomes.

STEP -03

Why Choose Us

As we all know, many vendors provide business data visualization service. What’s uncommon is that our team not only has deep technical expertise, but they also understand your business’s pain points.

  • End-to-End Visualization Expertise

    From suggesting solutions to setting up dashboards in your systems, we take care of all.

  • Business-First Dashboard Design

    We always ask what problem we need to solve with the solution, before actually building anything.

  • Tool Agnostic Approach

    We do not have any problem working with your existing tools for your comfort.

  • Custom Solutions Only

    We do not use generic templates. We customize solutions according to the business demand.

  • Fast Time to Value

    With the day one dashboards are ready to process data and generate reports.

  • Dashboards That Get Used

    You and your team will be using our build dashboards daily, as they actually provide what we promise.

  • Post-Delivery Support

    We do not disappear after the deployment. We stay and optimize the performance of the solution.

  • Transparent Process

    We communicate clearly and believe in transparency throughout the engagement by involving you in every decision.

Tools & Technologies We Master

  • Python
  • SQL
  • Power BI
  • Tableau
  • Excel
  • AWS
  • Azure
  • Google Cloud
  • TensorFlow
  • PyTorch
  • Snowflake
  • Databricks

Client Testimonials

VP of Strategy headshot
★★★★★
Head of Analytics, Finance Flow India

We used to wait for two to three days for weekly reports. Now with real-time dashboards, every morning, the first thing we do is analyze daily performance.

Chief Data Officer headshot
★★★★★
Vice President of Operations, Logi Track

Their build operational dashboards brings us the clear vision that we never had before. There was an issue in the supply chain that could become a serious problem, but we spotted it at the right time with the insights dashboard provides.

Director of Analytics headshot
★★★★★
Data Platform Lead, Nord Health

They actually spent time on understanding our data and workflows before building the clean, intuitive, and manageable dashboard. The dashboard was exactly as we wanted for our non-technical staff to effortlessly engage with it daily.

Frequently Asked Questions

Asked Questions

Ready to Make Every Business Decision a Data-Driven One?

All the answers your business is looking for are somewhere hidden in your data. Let us suggest the right data visualization solutions to access those answers.

info@ndatalance.net

Book A Free Consultation Now